Ecommerce Search
Part of Search result changes and AI features
Evaluating search feature changes with first-party performance data
Compare Search Console, analytics and business records to investigate search feature changes without claiming an unproven cause.
To investigate a search feature change, define the affected pages and the business action that matters. Compare the same reporting slices before and after the observation.
Search Console can show visibility and clicks; configured analytics and business records can show what happened after arrival. A before-and-after pattern is an association, not proof that the feature caused it.
Define the question and comparison
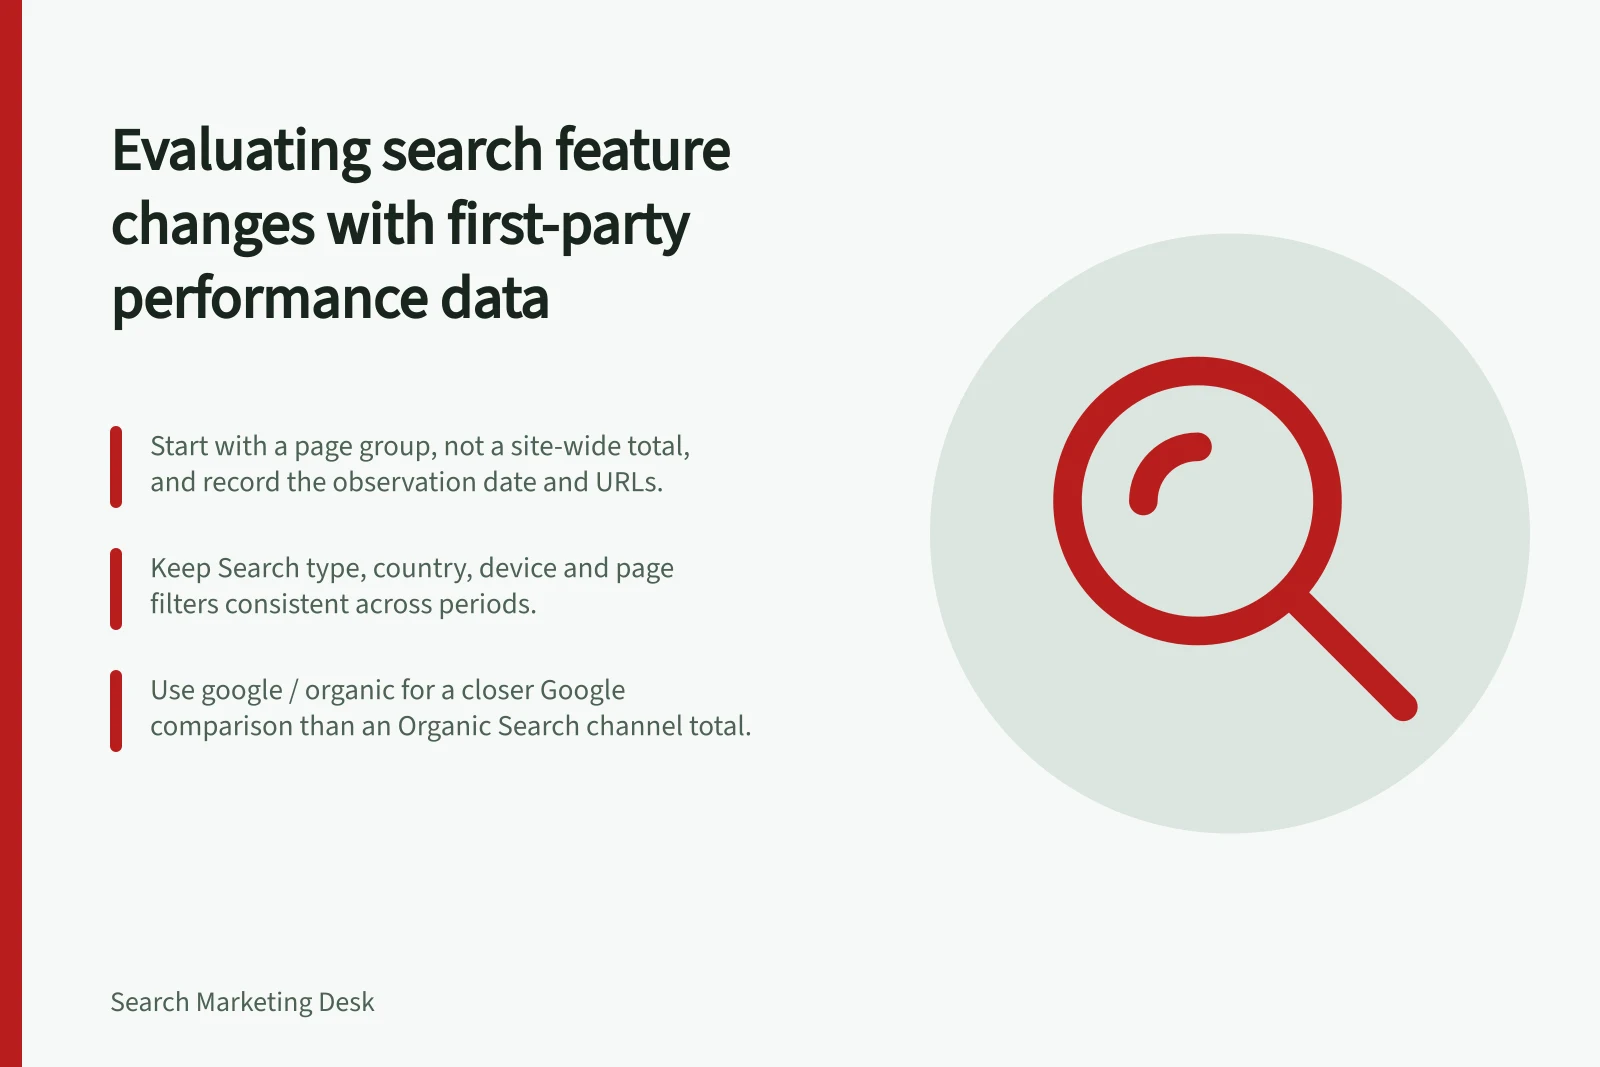
Start with a page group rather than a site-wide total. For example: “Did our current service pages receive fewer relevant Google Search clicks after we first observed AI Overviews on these topics?”
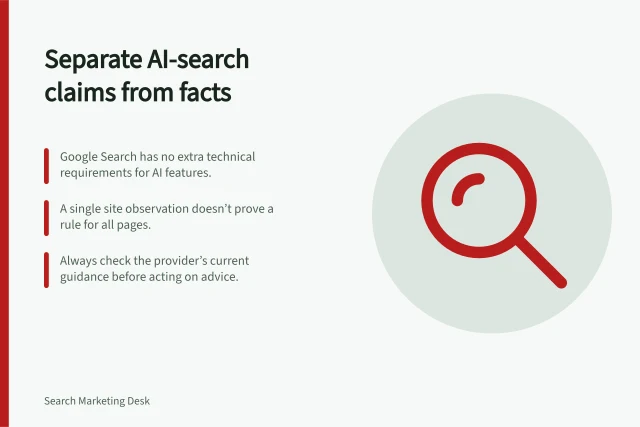
Record the observation date, queries checked, page URLs and site releases around that time. An AI Overview seen once may not appear for another user or a later search.
Choose comparable periods. Keep Search type, country, device and page filters consistent. An Australia country filter identifies where searches originated; it does not show whether each person was inside a local service boundary.
Six steps for investigating a suspected search feature change
- Define the page group and the business action that mattersStart with a page group, not a site-wide total
- Record the observation date, queries checked, page URLs and site releasesAn AI Overview seen once may not appear for another user or a later search
- Choose comparable periods with consistent Search type, country, device and page filtersKeep the reporting slices identical before and after
- Compare the page group, then identify the pages, queries, countries and devices involvedRead impressions alongside clicks and check the query mix
- Check the Generative AI report for the same pages and align each source's time zoneAlignment is needed before any day-by-day comparison
- Check other explanations and write a conclusion naming pages, filters, periods, change and next actionAn association is not proof of cause
Use each measure for its own purpose
| Source | Useful measure | Limit |
|---|---|---|
| Search Console Generative AI performance report | The generative AI visibility measures that the report provides, checked against its current documentation | Do not assume it shows answer text, citation wording, click counts or enquiry counts; confirm what the report includes before using it as evidence |
| Search results Performance report | Search performance measures for the selected filters, as defined in the report | A change does not identify its cause |
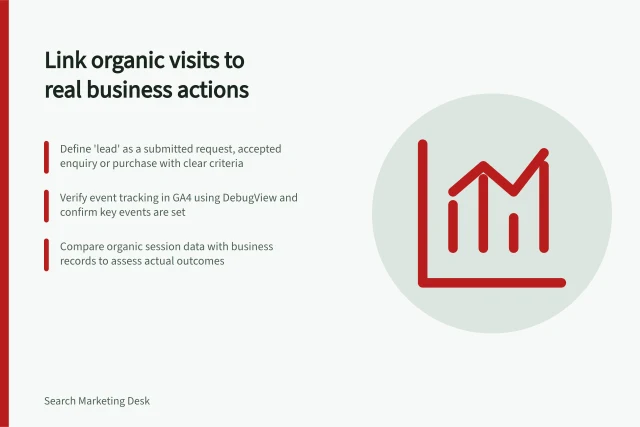
| GA4 Traffic acquisition, if configured | Traffic acquisition data and any configured event or conversion measures | A session is not a Search Console click; an event is not necessarily a suitable lead |
| Enquiry or sales records | Whether actions met the business's criteria | They do not identify a particular search feature without a supported attribution method |
Before combining generative AI visibility data with other Search Console performance totals, check how the relevant report defines and aggregates its metrics. If the report is unavailable, record that as a data gap rather than inferring a cause.
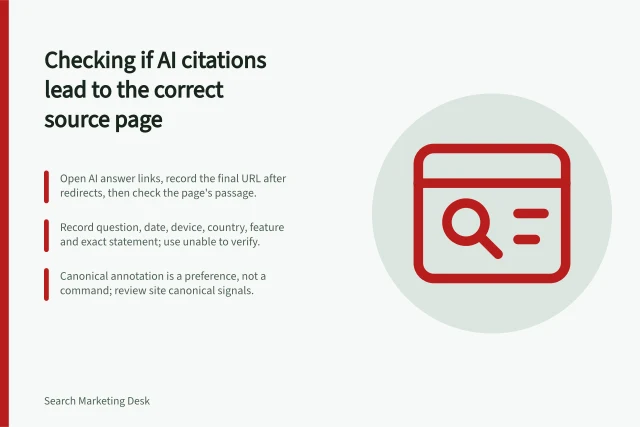
Before treating an old address and its replacement as separate pages, check how the report assigns pages and whether redirects or canonical choices affect that mapping. Use the report's current documentation to confirm page attribution.
google / organic gives a closer Google comparison than an Organic Search channel total that may include other engines. Search Console and GA4 still use different definitions and need not produce matching totals.
Locate the movement
Compare the page group first, then identify the pages, queries, countries and devices associated with the change. Read impressions with clicks.
Falling clicks alongside falling impressions raises a different question from stable impressions and fewer clicks. Check query mix before treating an average rate as a verdict on the page.
Use the Generative AI report to see whether the visibility it reports changed for the same pages. That visibility data does not reveal what the answer said, whether someone clicked or why another metric moved. Check the report's documentation for how its totals are calculated before reconciling chart and table views.
Check the time zone used by each data source and align periods before making a day-by-day comparison; an Australian business may record analytics in a local time zone. Search Console data can be affected by anomalies, so check Google's data-anomaly record when a surprising movement falls on an incident date.
Check other explanations
Review releases, redirects, indexing status, offers, promotions, tracking changes and seasonal demand. Inspect the affected page: does it still answer the query and allow a suitable visitor to act?
A useful conclusion names the pages, filters, periods, observed change, alternatives checked and next action. “Clicks fell on these pages; inspect their query mix and destinations” is supportable. A claim that AI Overviews took the site's leads needs stronger evidence.
Alternatives to rule out before blaming a search feature
- Site releases shipped around the observation date
- Redirects and canonical choices affecting how pages are assigned
- Indexing status of the affected pages
- Offers and promotions running in the comparison periods
- Tracking or tag changes in analytics
- Seasonal demand shifts
- Inspect the affected pagedoes it still answer the query and allow a suitable visitor to act?